
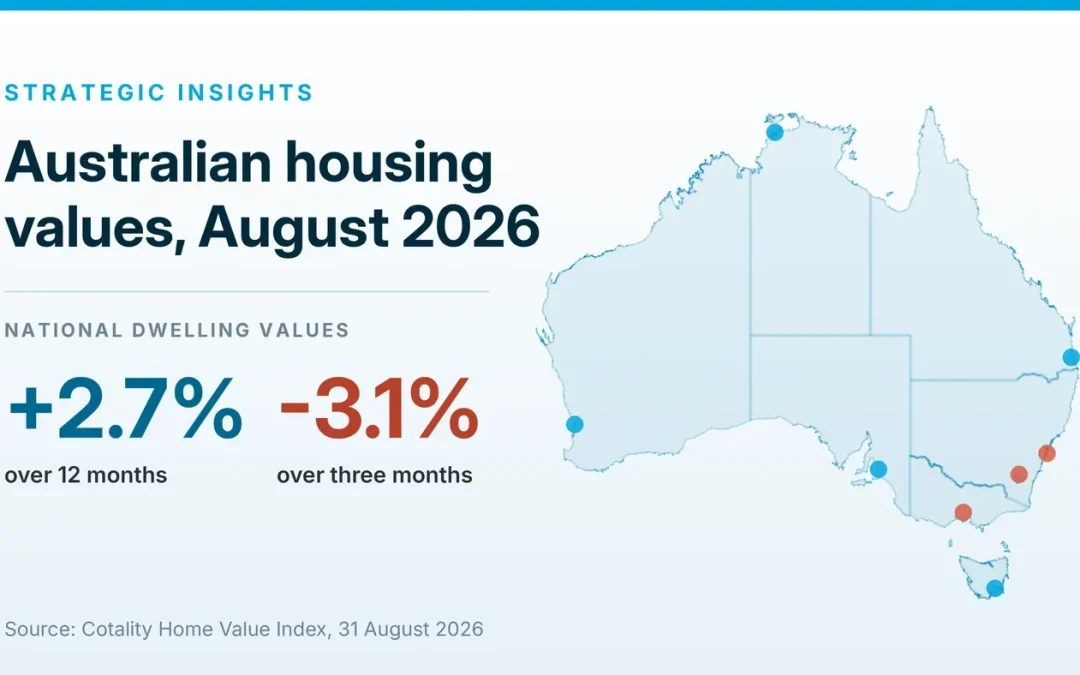
Seven of eight capital cities fell in August
The Cotality Home Value Index for August 2026 records a fifth consecutive monthly fall and declines across 93 per cent of capital city suburbs. Five capitals still show growth over the twelve months. This is an assessment of which of those two readings belongs in a purchase decision this spring.
Cotality published its August index on the 1st of September. Five capital cities still show growth over the twelve months, two of them in double digits. Seven of the eight recorded a fall in August itself, and the national index has now declined for five months in a row.
Both sets of figures are accurate. They describe different markets, and only one of them is the market an investor buys into this spring. What follows works through the August release, what sits behind it in rates, lending and tax, and how advisors across our network are reading it.
The annual figures describe a market that has already turned
Perth records annual growth of 15.6 per cent. Over the three months to August, Perth values fell 3.2 per cent. Brisbane is up 10.8 per cent across the year and down 2.7 per cent across the quarter. Adelaide and Hobart show the same reversal at a smaller scale.
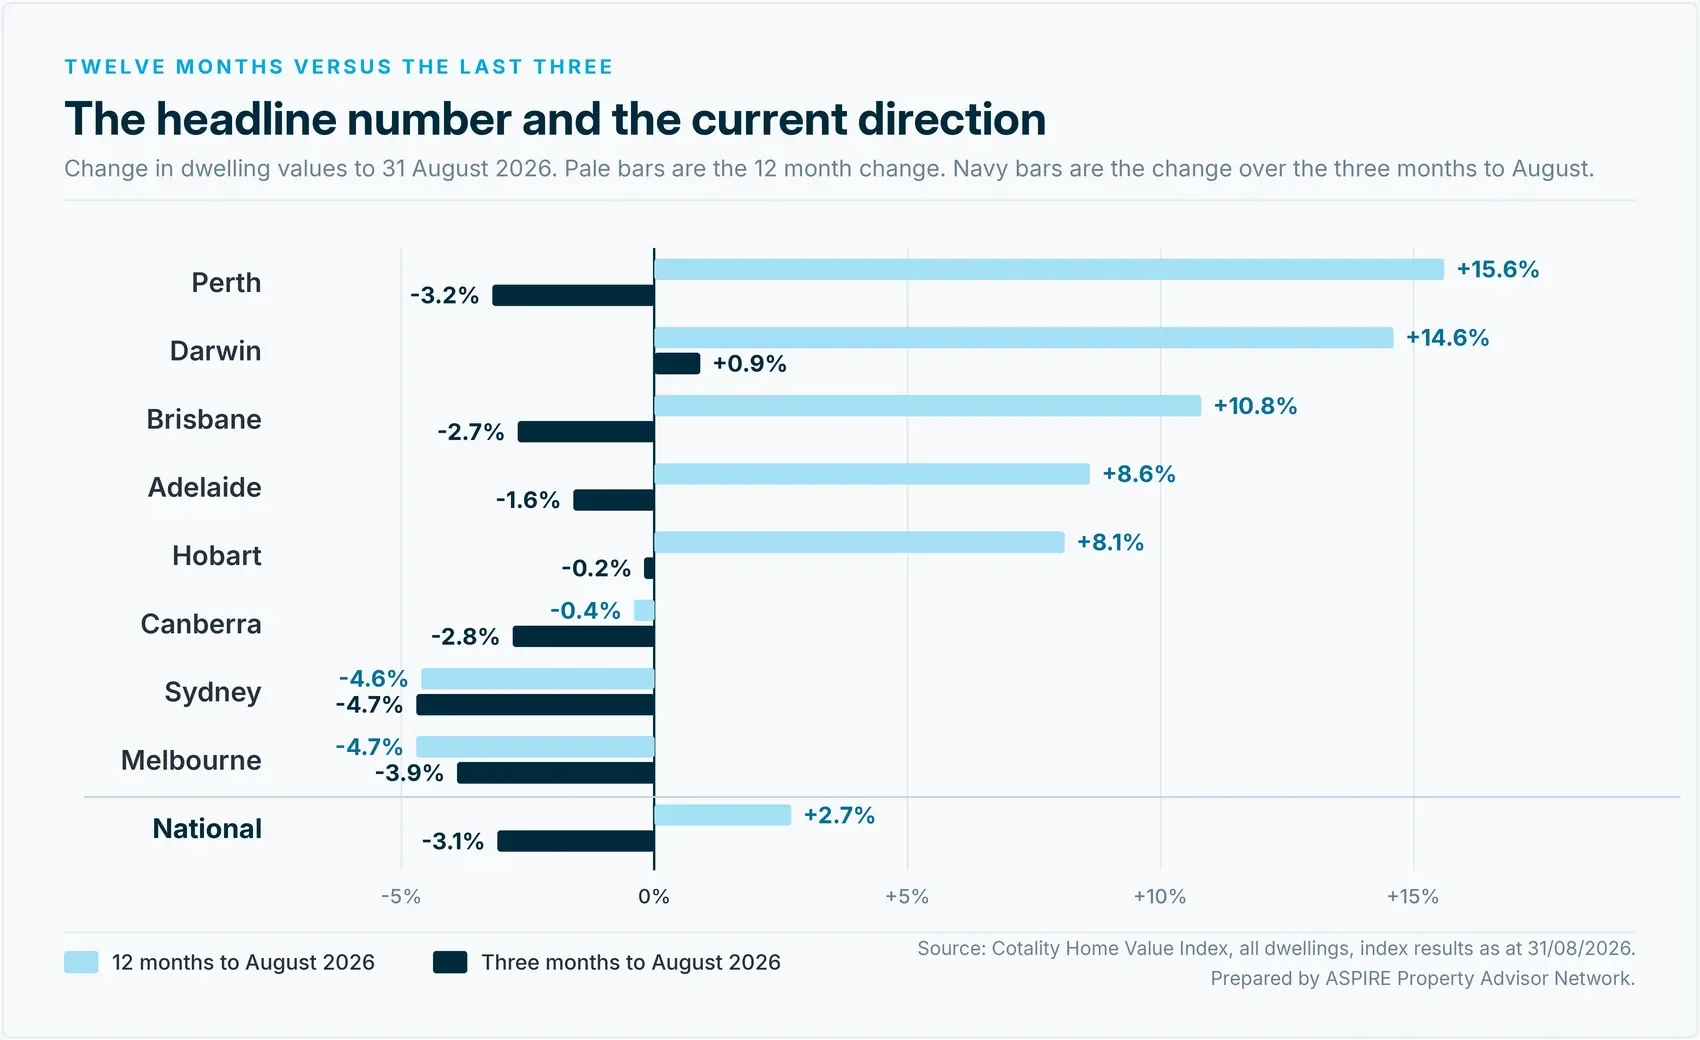
An annual figure reports what a market did across the preceding twelve months, most of which occurred before the turn. A purchase settled in November is exposed to what the market is doing now. On the August release those two measures point in opposite directions in five of the eight capitals, which is the widest divergence in this cycle so far.
Darwin is the single exception, positive on the month, the quarter and the year. It is also the smallest capital by value, on a median of $647,259, and the most sensitive to a narrow local economy. One market holding its direction is worth noting. It is not a national signal.
The decline is now general rather than selective
Values fell across 93 per cent of capital city suburbs over winter. The national index sits 3.6 per cent below its peak. Sydney peaked in February and has given back 7.1 per cent, a faster rate of decline than the equivalent stage of its 2022 correction. Melbourne remains 6.8 per cent below the high it set in March 2022 and has not retaken it.
Demand tells the same story. The quarterly estimate of sales is running 15.5 per cent below the same period last year and 11.5 per cent below the five year average, with Brisbane, Perth and Sydney each down more than 20 per cent on a year ago. Capital city listings sit roughly 24 per cent above where they were twelve months ago. Stock has risen while the buyer pool has contracted, and that combination is what produces negotiating room.
One caution on the data itself. First prints are provisional. The August release revised July's national fall from 0.7 per cent to 1.2 per cent, and revised Perth from a 0.1 per cent gain to a 1.3 per cent fall. A decision anchored to a single month's first estimate is anchored to a number that may still move.
The growth of the past year sat at the affordable end
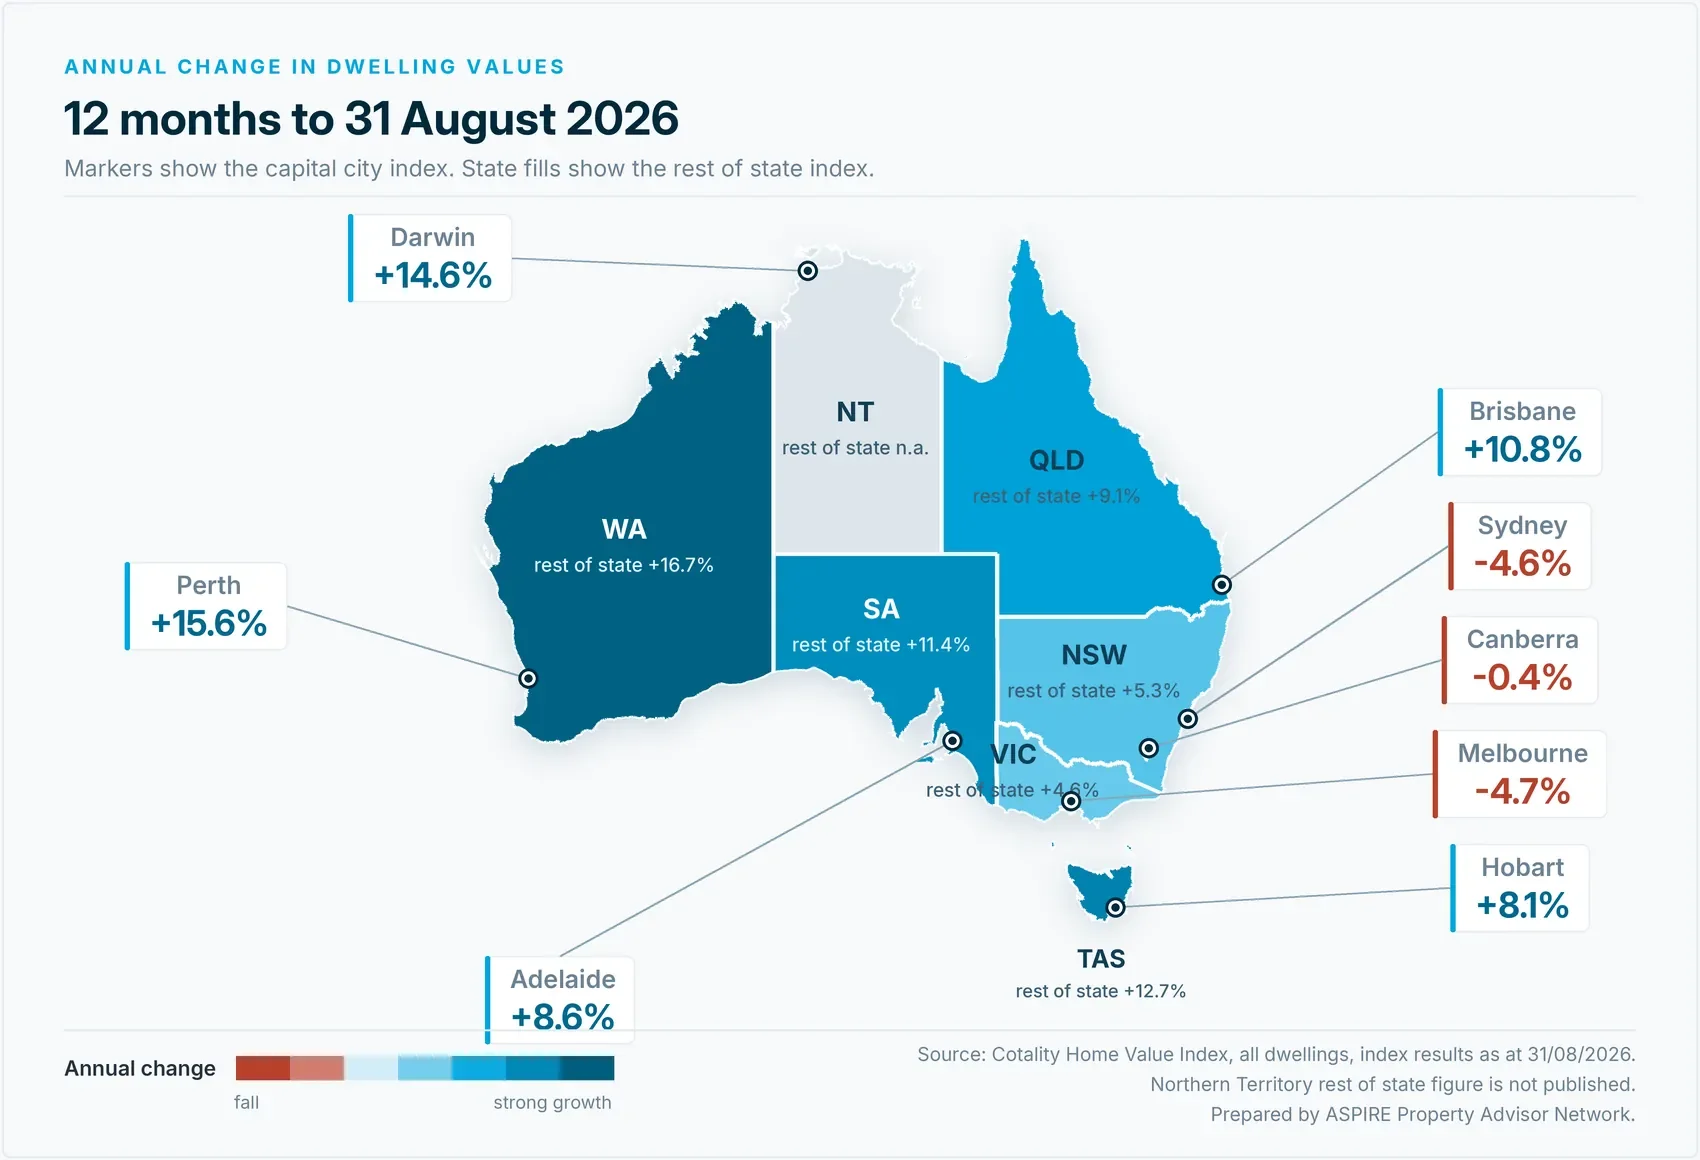
Regional Western Australia rose 16.7 per cent over the year, regional Tasmania 12.7 per cent and regional South Australia 11.4 per cent. The regional aggregate at 7.7 per cent sits well clear of the combined capitals at 1.1 per cent.
The more instructive number is the split by price point. Lower quartile values rose 10.8 per cent over the year while upper quartile values rose 0.7 per cent. That gap describes an affordability rotation rather than a broad expansion. Buyers priced out of the upper quartile competed for what they could still service, and the cheaper end absorbed the demand. When borrowing capacity contracts, that mechanism stops working. It has now stopped.
| Region | Month | Quarter | Annual | Median value |
|---|---|---|---|---|
| Sydney | -1.4% | -4.7% | -4.6% | $1,222,718 |
| Melbourne | -1.1% | -3.9% | -4.7% | $786,718 |
| Brisbane | -1.0% | -2.7% | +10.8% | $1,080,142 |
| Adelaide | -0.8% | -1.6% | +8.6% | $937,207 |
| Perth | -0.8% | -3.2% | +15.6% | $999,987 |
| Hobart | -0.2% | -0.2% | +8.1% | $752,397 |
| Darwin | +0.6% | +0.9% | +14.6% | $647,259 |
| Canberra | -1.1% | -2.8% | -0.4% | $864,998 |
| Combined capitals | -1.1% | -3.7% | +1.1% | $990,394 |
| Combined regional | -0.4% | -1.2% | +7.7% | $764,020 |
| National | -0.9% | -3.1% | +2.7% | $912,885 |
Rents and yields moved the other way
The national gross rental yield reached 3.79 per cent in August, the highest reading since September 2019, with the combined capitals at 3.6 per cent and the regions at 4.3 per cent. Rents rose 5.7 per cent over the year, about $38 a week on the national median, and 39 per cent over five years.
This requires a qualification that is easy to skip. A yield improves when rent rises or when value falls, and both are happening at once. Only the first improves the cash position of a property already held. Cotality's vacancy measure also lifted to 1.9 per cent in August, its highest reading since January 2025, with Sydney the loosest of the mainland capitals at 2.2 per cent. Rental conditions remain tight by historical standards and they are no longer tightening.
A gross yield of 3.79 per cent against a cash rate of 4.35 per cent still leaves a geared purchase materially negative before costs. Improved yields change the size of the shortfall, not its existence.
Borrowing costs and the tax changes are pulling the same way
The Reserve Bank held the cash rate at 4.35 per cent on the 11th of August, after three increases earlier in the year. Headline inflation eased to 3.5 per cent over the year to July while the trimmed mean measure held at 3.6 per cent, both above the target band. Financial markets are pricing a further increase at the meeting on the 29th of September as more likely than not.
The tax settings compound the effect rather than offsetting it. From the 1st of July 2027, rental losses on established residential property acquired after 7.30pm on the 12th of May 2026 can no longer be offset against salary. Eligible new builds are exempt and retain the 50 per cent capital gains tax discount. Borrowing to buy residential property inside a self managed super fund closed to new arrangements on the 10th of August 2026.
Lending data already carries the result. The most recent Australian Bureau of Statistics figures show investor loan numbers down 8.6 per cent and investor lending values down 10.2 per cent, against a 3.3 per cent fall in owner occupier loan numbers. Investors are stepping back roughly three times faster than owner occupiers, which matters because owner occupiers set the price in most established markets.
Supply will not resolve this quickly. There were 244,000 dwellings under construction in the March quarter, the highest figure since the series began in 1984, yet approvals in July came in at 17,687, down 3.6 per cent on June although 9 per cent higher than a year earlier. The pipeline is large, slow and largely committed. It responds to conditions from two and three years ago rather than to this spring.
What we are seeing on the ground
Three patterns are consistent across the network at the moment.
Vendor expectations are still anchored to last year's evidence. Advisors across our network are reporting a wider than usual gap between asking prices and achievable prices, and properties are spending longer on market while that gap closes. Anchoring an offer to recent comparable sales rather than to asking prices or to annual growth figures is doing more work for buyers this quarter than it has in several years.
The order of client questions has reversed. Conversations that used to open with location now open with the tax position, and in particular with whether a property qualifies as an eligible new build. It is important to understand that a deduction reduces the cost of holding an asset. It does not improve the asset, and a property selected because of its tax treatment is a property selected on the one variable the Commonwealth can change again.
Prepared buyers are finding conditions that have not been available since 2022. More stock, fewer competing bidders and vendors who will negotiate is a genuinely useful combination for anyone with finance approved, a clear brief and the capacity to hold through a further rate increase. The opportunity sits in that preparation rather than in the timing.
How to read the August release
The practical instruction from this data is to work from the quarterly and monthly series when making a decision and to treat the annual figure as history. Stress test at a rate above today's rather than at today's, because the next move is more likely to be up than down. Assume a vacancy period and a maintenance event in the same year and check whether the position still stands. Calculate the land content as a share of the purchase price for every option under consideration, because the affordability rotation that drove the past year has ended and the buildings will not do the work from here.
A falling market is not automatically a buying opportunity, and it is not automatically a reason to wait. It changes the price of entry, the strength of the buyer's position in a negotiation and the cost of getting the selection wrong. Every investor's position is different, and the key is applying the right strategy at the right time, with the correct asset for the goal held today and the exit expected later. This is about making informed decisions rather than reacting to a headline number that describes last year.
Data sources
Dwelling values, rents, yields, vacancy and sales volumes: Cotality Home Value Index, index results as at 31 August 2026, released 1 September 2026. Cash rate and inflation: Reserve Bank of Australia and Australian Bureau of Statistics monthly consumer price index indicator. Building approvals, dwellings under construction and lending: ABS Building Approvals, ABS Building Activity and ABS Lending Indicators. Legislative measures: Treasury Laws Amendment (Tax Reform No. 1) Act 2026 and Australian Taxation Office published guidance.
General information only. This article is provided for education and does not take into account any individual's objectives, financial situation or needs. It does not constitute financial, credit, taxation or legal advice. ASPIRE Property Advisor Network supports independent accredited property advisors and does not provide taxation or financial product advice. Market data is current to 31 August 2026 and is sourced as noted above. Taxation positions must be confirmed with a registered tax agent and borrowing capacity with a licensed mortgage adviser.
Read the market against your own position
A national index describes an average of thousands of markets. The figure that decides a purchase is the one that applies to a specific property, a specific borrowing position and a specific timeframe.
Accredited advisors across the ASPIRE network apply the same research and due diligence framework to every opportunity. Every portfolio is different, and the right next step depends on goals, timing and borrowing position.
Be Connected With An Accredited AdvisorIndependent. Accredited. No product to sell.