
Six months of falling values, and where the opportunity sits
Cotality's September index, a fourth interest rate rise and the latest population and supply figures all arrived within a fortnight. Read together, from the national settings down to individual markets, they describe a market that is weaker in the short term and more undersupplied in the long term.
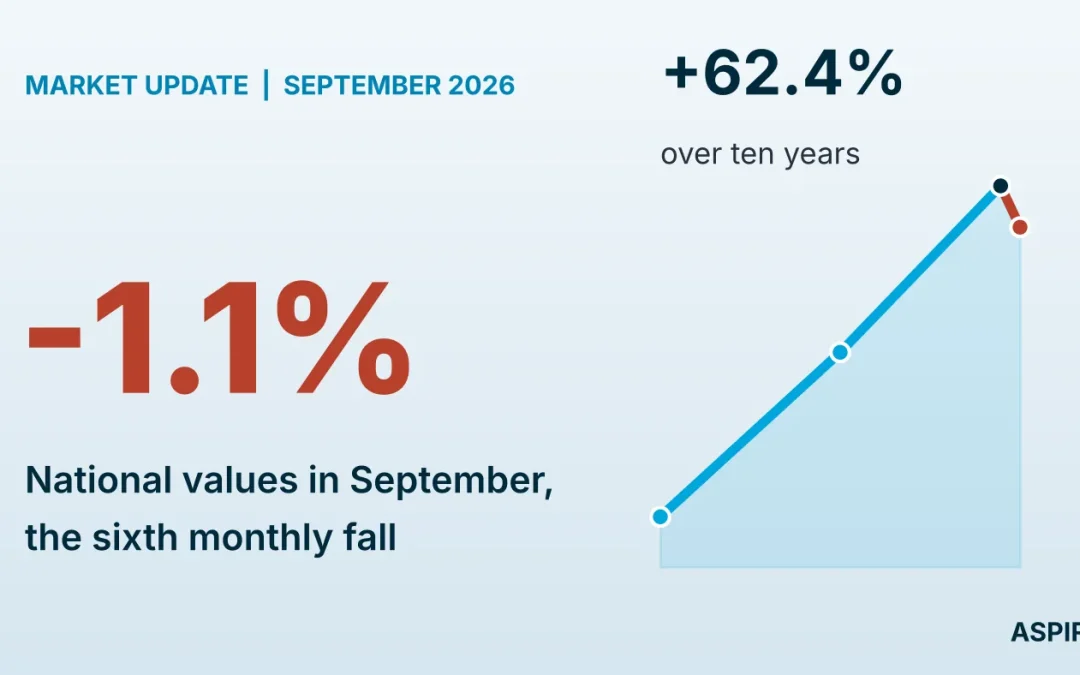
National dwelling values fell 1.1 per cent in September. Values are now 5.2 per cent below the March peak, and 97 per cent of capital city suburbs recorded a fall over the past three months. Over twelve months the national change rounds to zero.
A flat national figure is the average of markets moving in opposite directions. Perth is up 10.1 per cent over the year and Sydney is down 7.0 per cent. The sections below move from the forces acting on every market to those that differ by state and suburb, and finish with how an investor can match a strategy and a timeframe to the data.
Four pressures are weighing on demand at the same time
The Reserve Bank lifted the cash rate by 25 basis points to 4.60 per cent on the 29th of September. It was the fourth increase this year and the cash rate is now a full percentage point above where it sat in January. Headline inflation reached 4.0 per cent over the year to August and the trimmed mean measure held at 3.6 per cent, both above the 2 to 3 per cent target band. The next decision is due on the 3rd of November.
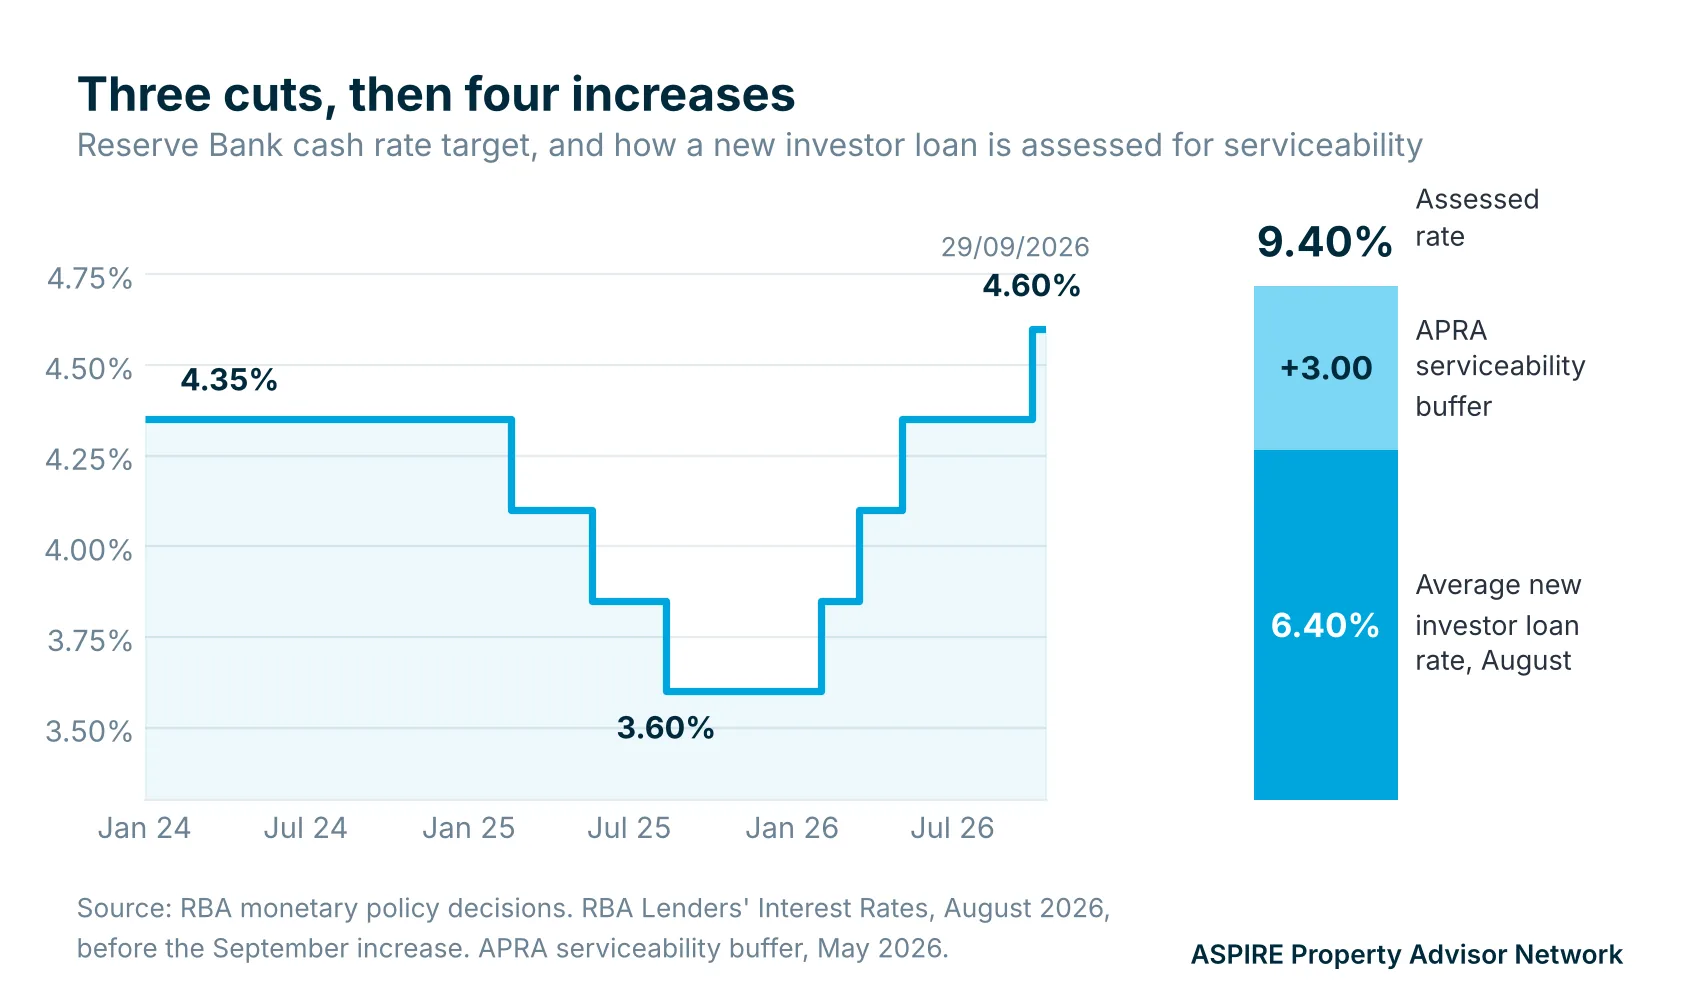
It is important to understand how a rate rise reaches a borrower. The average new investor loan was written at around 6.40 per cent in August, before the latest increase. Lenders then add the APRA serviceability buffer of three percentage points, so the loan was assessed at roughly 9.40 per cent, and closer to 9.65 per cent once the September increase passes through. On an $800,000 loan, assessment at 9.40 per cent means demonstrating capacity for repayments of about $6,670 a month, against actual repayments closer to $5,000. Each percentage point added to the assessment rate reduces borrowing capacity by around 8.5 per cent on the same income and expenses, and the cash rate has risen by a full point since January without any change in the borrower's own circumstances.
The second pressure is tax. From the 1st of July 2027, established residential property bought after 7.30pm on the 12th of May 2026 loses the ability to offset rental losses against wages and salary. Property already held at that time is grandfathered. The 50 per cent capital gains tax discount is replaced by inflation indexation with a 30 per cent minimum tax rate, for gains that accrue from the 1st of July 2027. Eligible new builds keep negative gearing and the investor can elect either capital gains treatment.
The third is lending. Australian Bureau of Statistics figures for the June quarter show owner occupier loan numbers 1.6 per cent lower than a year earlier, the first annual fall since September 2023. Investor loan numbers fell 8.6 per cent in the quarter alone, the largest quarterly fall since September 2022. The fourth is confidence. Cotality describes household confidence as deeply pessimistic, and home sales over the past three months are running 19.1 per cent below the same period last year, with Brisbane down 27.2 per cent and Sydney down 26.5 per cent.
Advertised stock is rising while the construction pipeline shrinks
Across the capitals, total advertised stock is 23.1 per cent higher than a year ago even though new listings are 9.2 per cent lower. Stock is accumulating because homes are selling more slowly, now a median of 39 days against 23 days a year ago. For a prepared buyer that means more choice, less competition and vendors who are adjusting their expectations.
The construction pipeline is moving in the other direction. The Housing Industry Association's analysis of ABS data shows 355,817 homes completed in the first two years of the National Housing Accord, 124,183 fewer than the 480,000 needed to stay on track, with commencements 94,980 behind the required pace. The number of trade apprentices and trainees in training has fallen 10.2 per cent since March 2022, and 15.5 per cent in the construction trades.
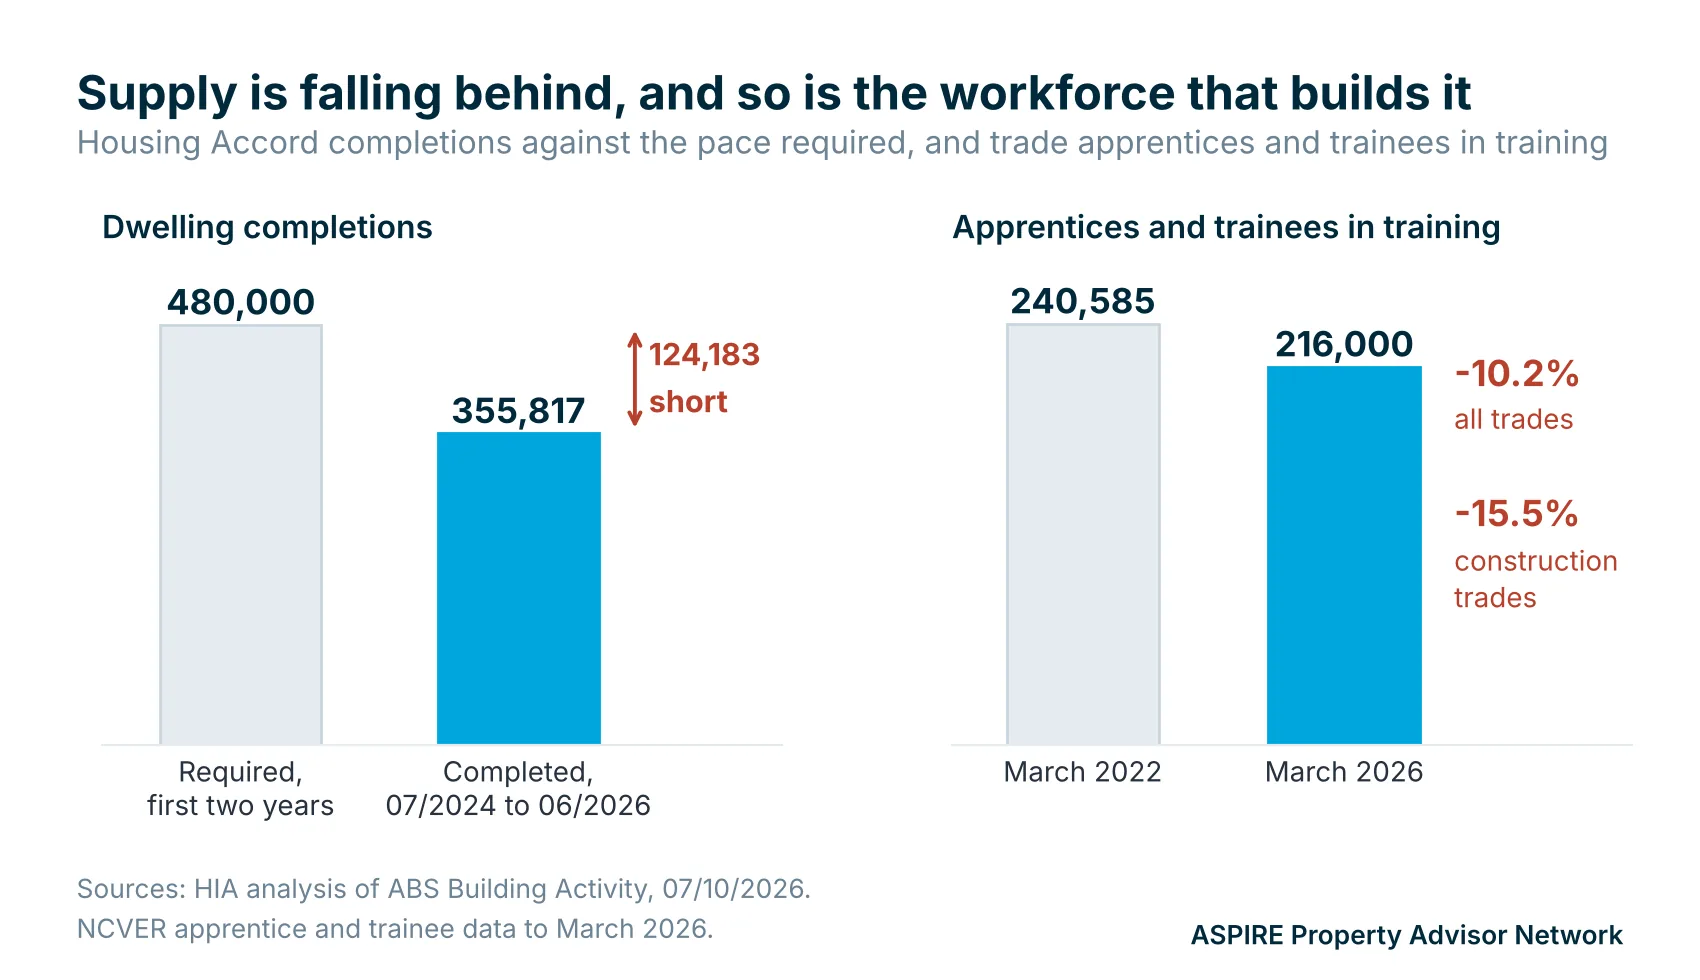
These two findings describe different timeframes. Advertised stock measures the existing market slowing down. The pipeline measures future supply, and it is shrinking at the same time that higher rates and the tax changes are making new projects harder to fund. The HIA expects the effect of this year's rate rises and Budget measures to show up in building activity during 2027. An investor working to a two year horizon sees buyer's conditions. An investor working to a ten year horizon sees a market that is building too few homes.
Population growth has slowed, and it is concentrating north and west
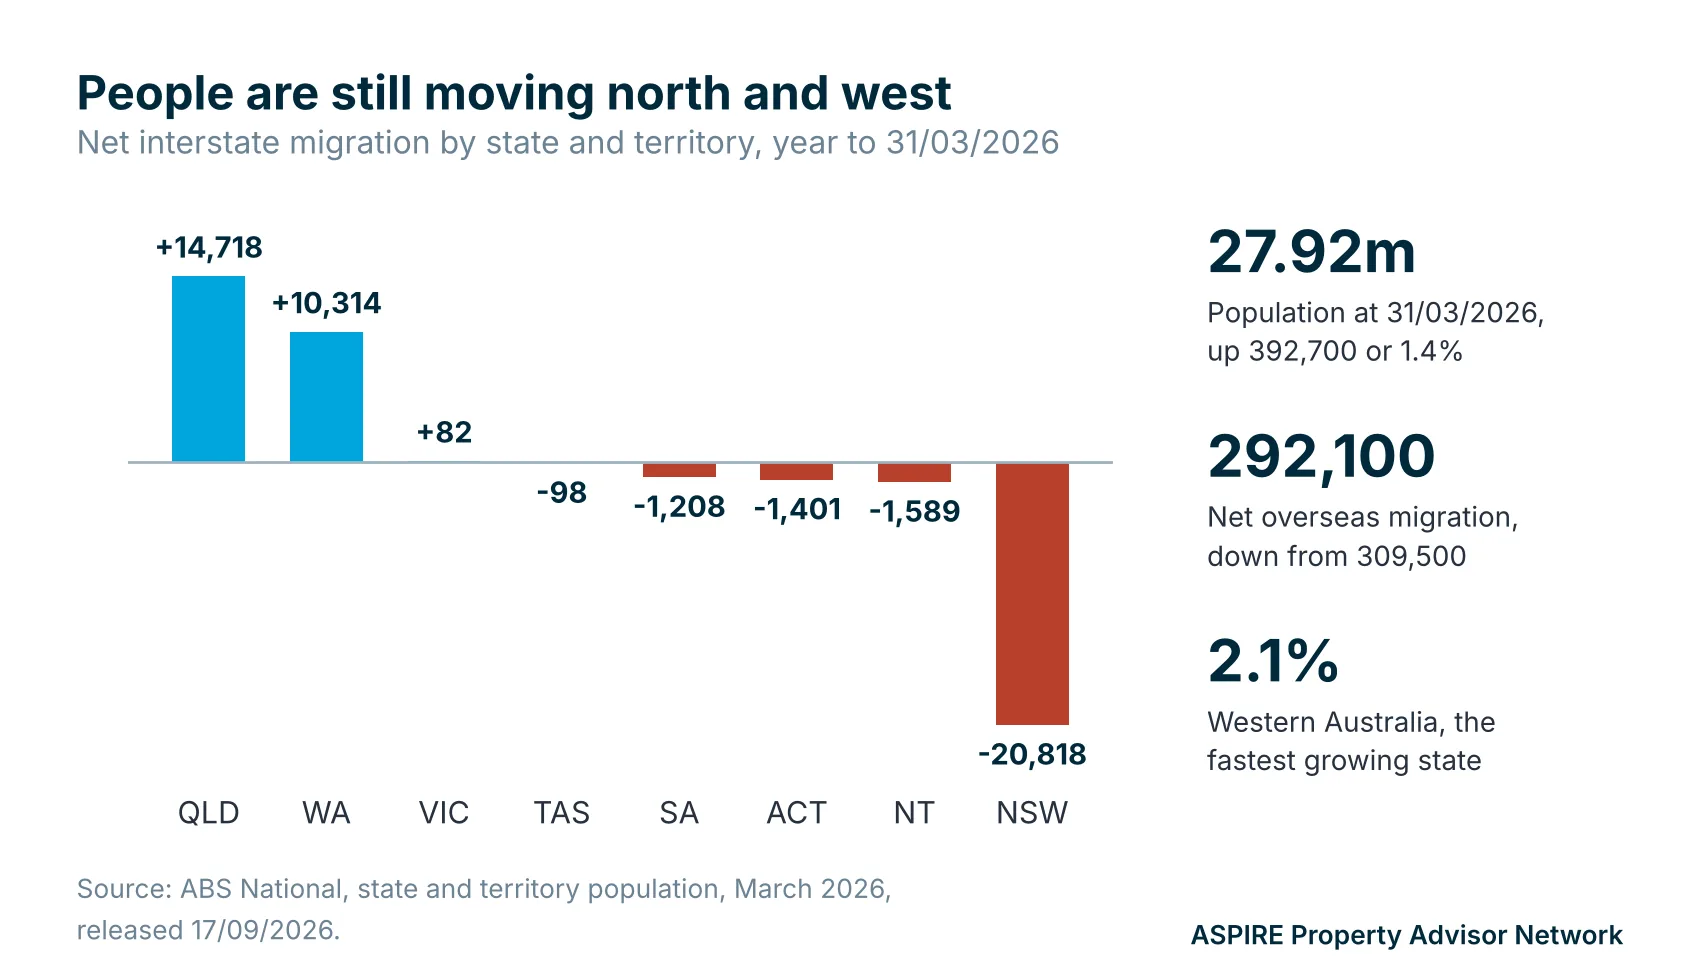
Australia's population reached 27.92 million at the 31st of March 2026, up 392,700 or 1.4 per cent over the year. Net overseas migration contributed 292,100, down from 309,500 the year before, and the Budget forecasts a further reduction to 245,000 in 2026-27. Migration is slowing, and it remains a substantial source of housing demand.
Where people choose to live matters as much as how many arrive. Queensland gained 14,718 residents from other states over the year and Western Australia gained 10,314, while New South Wales lost 20,818. Western Australia was the fastest growing state at 2.1 per cent.
Rents are still rising, and the rental market is no longer tightening
National rents rose 5.5 per cent over the year, although the monthly increase of 0.3 per cent in September was the smallest since May 2025. Cotality's national vacancy rate has moved up to 2.0 per cent from a record low of 1.5 per cent in February. That is the highest reading since January 2025 and still well below the pre-COVID decade average of 3.3 per cent. Hobart is the loosest capital at 3.0 per cent and Adelaide the tightest at 1.4 per cent.
Gross rental yields have risen to 3.85 per cent nationally, ranging from 3.4 per cent in Sydney to 6.5 per cent in Darwin, with the regions at 4.3 per cent. Part of that improvement comes from falling values, which does nothing for an investor who already owns, and at current interest rates a neutral or positive cash flow remains uncommon. Yields are repairing, and income now carries more weight in a purchase decision than it has for several years.
Every location carries both macro and micro forces
The national settings apply everywhere. How they land depends on the local economy, the local supply and the local buyer, which is why the correction looks so different depending on where and over what period it is measured.
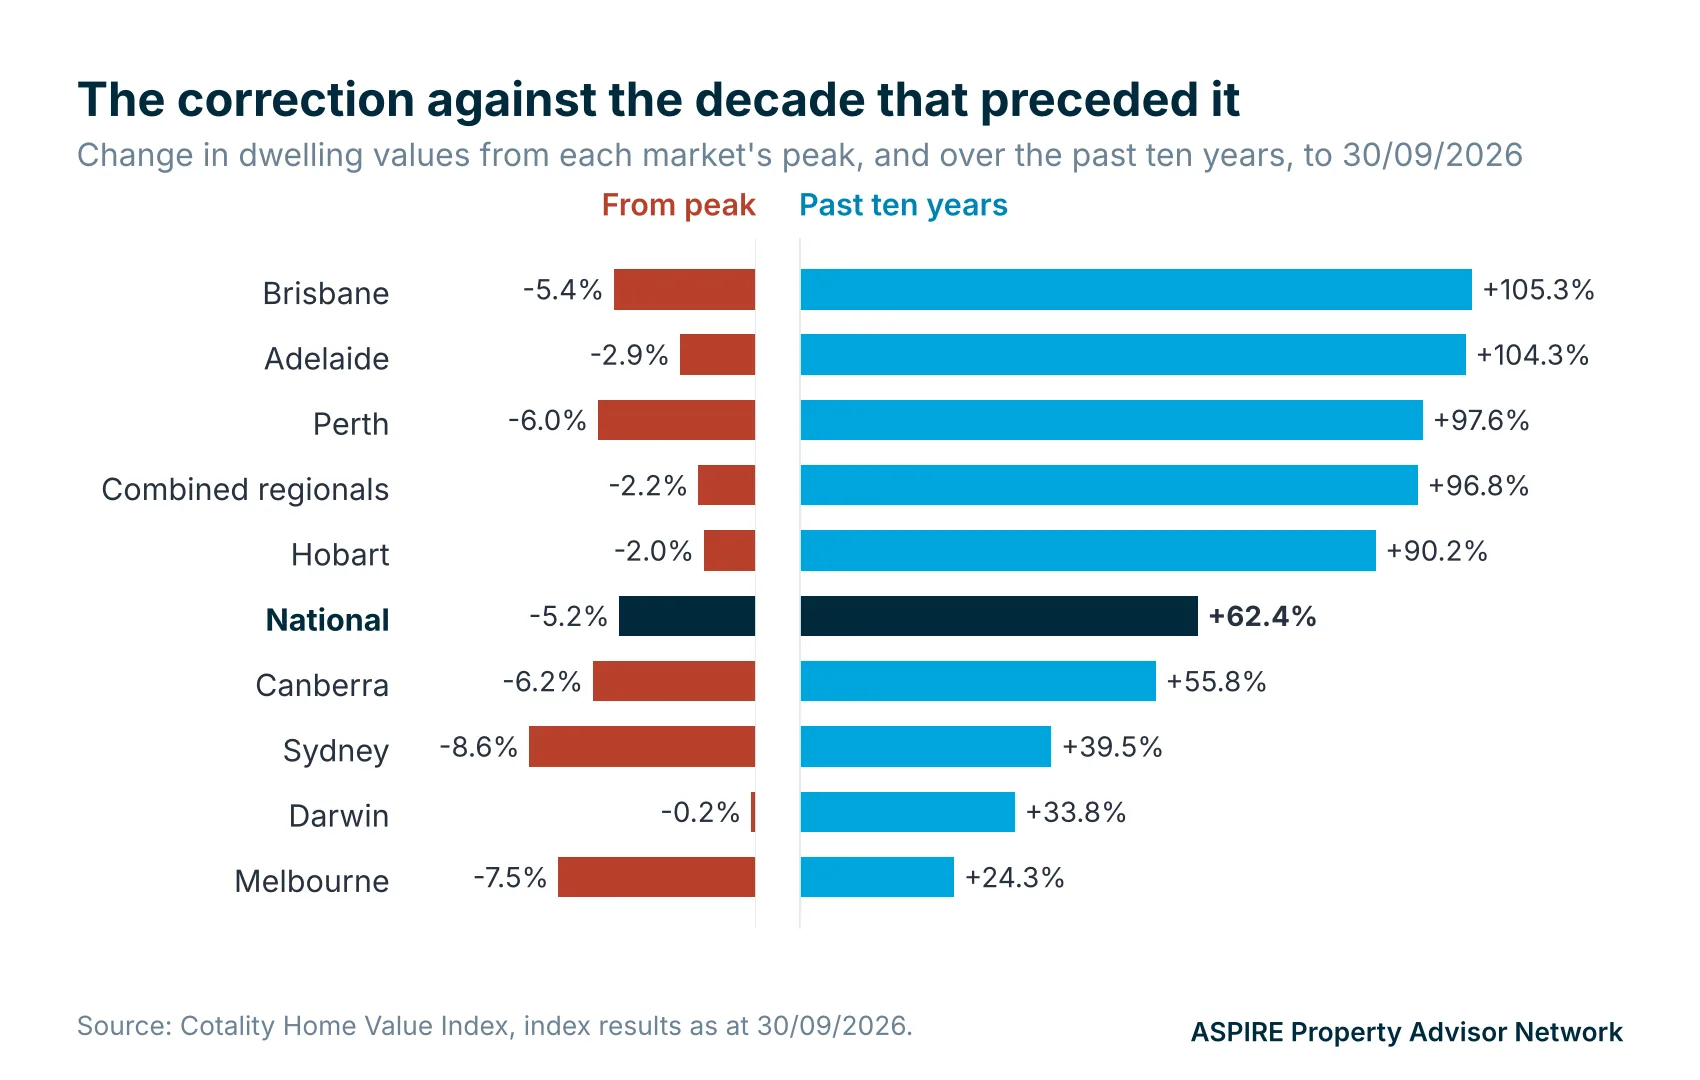
Brisbane values are 5.4 per cent below their May peak and 105.3 per cent higher than ten years ago. Melbourne is 7.5 per cent below a peak it set in March 2022 and has grown 24.3 per cent over the decade. Regional markets are down 1.9 per cent over the quarter against 4.3 per cent for the combined capitals, and remain 5.6 per cent higher over the year.
The spread within each city is wider again. Over the past year the strongest part of Greater Sydney, Wollondilly, rose 2.0 per cent. In Greater Brisbane, Sherwood and Indooroopilly rose 10.7 per cent and Caboolture 8.7 per cent. In Greater Perth, Serpentine and Jarrahdale rose 15.3 per cent and Mandurah 14.6 per cent. Regional centres with diversified employment, including Armidale, Wagga Wagga, Bunbury and Toowoomba, recorded growth above 10 per cent. Much of that growth occurred before the market turned, and these figures are not a list of places to buy. They show why a capital city average says little about a specific suburb, and why the analysis has to continue down to employment, vacancy, nearby new supply and the depth of the buyer pool at resale.
What we are seeing on the ground
Advisors across our network are reporting the same pattern in client conversations. Many investors who were ready to proceed earlier in the year have paused without actually deciding to wait. Conversations framed around a twelve to twenty four month plan are proving far more productive than conversations about buying now, and in several cases clients who started with a two year horizon found they were in a position to act sooner once the numbers were on paper.
Equity positions have moved with the market. National values are 5.2 per cent below the March peak and Sydney values are 8.6 per cent below their February peak. On a property valued at $1,000,000 at the national peak, that is around $52,000 less equity to borrow against. An equity figure obtained earlier in the year should be confirmed with a current valuation before it forms part of a plan.
For this reason the finance strategy is being set before the property brief rather than after it. Where capacity is tight, the asset needs to settle inside the approval window, which favours titled or near complete stock. Where capacity is strong and the horizon is long, land that titles in twelve months or more can mean settling into a different part of the cycle, with the valuation risk that carries. Builders holding land under option are offering rebates and upgrades to clear stock. An incentive is worth asking for, but it does not change the quality of the asset.
Matching the strategy and the timeframe to the data
Cotality's assessment is that the balance of risks has shifted further to the downside, and that a gradual drift lower in values is more likely than a material downturn, supported by a still resilient labour market and persistently low new supply. A further rate increase in November is possible. None of the data suggests the next few months will be easy.
The opportunity sits in the gap between the short term and the long term. Buyers currently have more choice and more negotiating room than they have had for several years. The supply that will compete with today's purchases in 2028 and 2029 is being cut back now. Population growth is concentrating in specific states and regions, yields are improving and the direction of the tax settings is now clear, with a commencement date attached. For investors who already hold established property, the period to the 30th of June 2027 is an opportunity to review the portfolio with their accountant while the current settings still apply.
The practical step for most investors is planning rather than a purchase. That starts with a conversation about goals, timeframe and comfort with risk, and leads to a documented plan, built with the investor's broker and accountant, before any property is considered. The right asset for one investor may not be right for the next. For investors who have paused and want a structured way to work through those questions, we have prepared an investor planning guide for uncertain markets.
Every investor's position is different. The key is applying the right strategy at the right time, in a location where the local data supports the national story, with a timeframe long enough to see it through. This is about making informed decisions rather than reacting to the headline.
Data sources
Dwelling values, rents, yields, vacancy, listings and sales volumes: Cotality Home Value Index, index results as at the 30th of September 2026. Cash rate: Reserve Bank of Australia monetary policy decision and Lenders' Interest Rates. Inflation: ABS Consumer Price Index, August 2026. Lending: ABS Lending Indicators, June quarter 2026. Population: ABS National, state and territory population, March 2026. Housing supply: Housing Industry Association analysis of ABS Building Activity, and NCVER apprentice and trainee statistics. Tax measures: Treasury, Budget 2026-27. Serviceability buffer: APRA. Borrowing capacity figures are ASPIRE calculations on a 30 year principal and interest loan.
General information only. This article is provided for education and does not take into account any individual's objectives, financial situation or needs. It does not constitute financial, credit, taxation or legal advice. ASPIRE Property Advisor Network supports independent accredited property advisors and does not provide taxation or financial product advice. Market data is current to the 30th of September 2026 unless otherwise stated and is sourced as noted above. Past performance is not a reliable indicator of future performance. Taxation positions must be confirmed with a registered tax agent and borrowing capacity with a licensed mortgage adviser.
Plan against your own position, not the national average
The figure that decides a purchase is the one that applies to a specific borrowing position, a specific location and a specific timeframe. Working that out properly takes research at both the macro and the micro level.
Accredited advisors across the ASPIRE network apply the same research and due diligence framework to every opportunity. Every portfolio is different, and the right next step depends on goals, timing and borrowing position.
Be Connected With An Accredited AdvisorIndependent. Accredited. No product to sell.